
Research · Q2 2025
A Strategy for (Micro)Strategy
MicroStrategy trades at a large premium to its bitcoin holdings, but buying bitcoin and shorting MSTR is not a free lunch. Robert Carver explores an alternative strategy, and walks through the real-world examples and frictions.
01Introduction
Would you like the chance to buy $1 for 50 cents? That isn’t easy, but there are people out there willing to pay a dollar and receive 50 cents in return. Of course I’m talking about MicroStrategy. A firm consisting mostly of a pile of Bitcoins (that’s the 50 cents) with a money losing software business thrown in, whose market cap is significantly greater than the sum of these parts (that’s the dollar).
(I will refer to the firm by its ticker, MSTR, so I don’t get confused in talking about Strategy, the firm, and a trading strategy which involves trading Strategy).
If we can sit on the other side of this trade, we can make some apparently risk free profits. Sadly, it’s not as easy as that.
02A Brief History of Capital Component Trades
The efficient markets theory purists would be very surprised that anyone would want to pay a dollar for 50 cents, or that you could buy a dollar for a couple of quarters. But it happens.
The purest example of this would be something like a closed end fund / UK investment trust. In the UK many of these funds have traded at a discount over the last few years. If you were able to short the underlying assets and buy the fund, you would make a profit when/if the discount closes1.
Please indulge me in a brief history lesson. In the late 1990s an electronics retailer called Dixons (now subsumed into Currys plc) owned one of the early UK-based internet ISPs2, Freeserve. This was subsequently listed with Dixons retaining most of their shares. Because of the internet boom, the Freeserve stake alone ended up being worth many times the market cap of Dixons, implying that the quite profitable Dixons shops had a massive negative value3.
An apparently straightforward trade would have been buying Dixons shares and shorting the overvalued Freeserve stock. But it wasn’t easy. Why not? Well, principally because the stock borrow fee on Freeserve was substantial. Because most of the shares were owned by Dixons, getting hold of shares to short was extremely difficult.
These trades are the living embodiment of the Keynes quote: “Markets can remain irrational longer than you can remain solvent.” Just because something trades at a relative discount or premium doesn’t mean the gap cannot widen before gravity brings it down4.
With these dark warnings from history in mind, let us look at MSTR in more detail.
03A Brief History of MSTR
Microstrategy (as was) was founded in 1989 by Michael Saylor, listed in 1998, and for most of its existence was a boring software company with a market cap that rarely exceeded $1bn. Even now, their website’s front page is mostly about “AI” (artificial intelligence) and “BI” (business intelligence, apparently – an oxymoron?), “the cloud”, “enterprise scale” and the buzzwords go on, and on… The software business currently has a modest revenue of about $450m a year. But they aren’t very good at software since they appear to be losing quite a bit of money on operating expenses.
However, on their website there is a tell-tale menu option: “Bitcoin”. Click on that, and there is a blizzard of figures, none of which have anything to do with “AI” or “BI”, and everything to do with “BIT”, and “COIN”. Moreover, if you click on their latest financial presentation, there is not a single mention of their software business until you get to the appendices! It’s all mostly about Bitcoin, with a few slides on their convertible bonds, their new website, and … their new merchandise store. This isn’t a company – it’s a cult!
This all began in August 2020 when MSTR bought $250m of BTC as a “treasury reserve”. Corporate treasuries are where you keep your corporate war chest of cash. Often it’s cash that will be needed in the fairly short term for working capital or meeting payroll, so usually it’s kept in fairly safe assets like treasury bills.
Sometimes firms will get a bit racy, and push into stuff that’s higher yielding. Usually that goes badly. Putting your corporate treasury into a highly volatile asset like Bitcoin with no natural yield seems…. well frankly it’s highly irresponsible. It really ought to be against the law.
Anyway, rant over: that brings us to the present day, when the MSTR numbers look like this as I write this (from strategy.com, menu option Bitcoin, though the numbers will be different when you check it yourself):
MSTR by the numbers
- MSTR market cap
- $71.6bn
- Debt and preferred
- $8.9bn
- Enterprise value
- $80.5bn
- Bitcoins owned
- 500k
- Bitcoin price
- $88.6k
- Value of BTC
- $44.2bn
- Cost of BTC5
- $32.6bn
Cost of BTC is not on the website; derived from the Q4 report and other information.
If you were to buy all the equity and the debt, costing just over $80bn you would end up with around $44bn worth of Bitcoins and a money-losing software business. That’s about 55 cents for each dollar, which still doesn’t seem like fantastic value.
There are a few different ways we could try and profit from this apparent stupidity. A very simple way would be to short MSTR and buy BTC, unless the premium reverses in which case we would go long MSTR and short BTC. As Keynes pointed out, the problem with such simple mean reversion trades is that the premium or discount can persist for a…. long…. time.
Consider the market cap of MSTR (blue) and the value of BTC owned (orange):
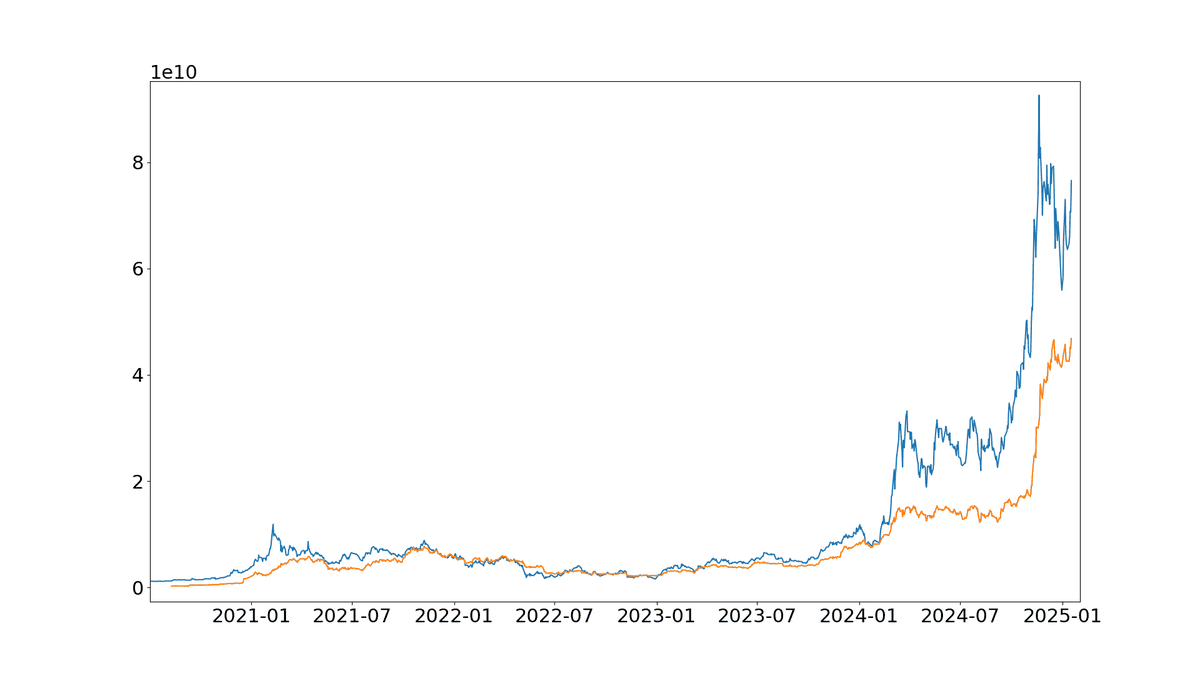
Although there was some nice mean reversion from 2021 to 2023, this would have been a money losing strategy from 2024 onwards as the premium exploded. This is even clearer if we plot the ratio of market cap to BTC held:
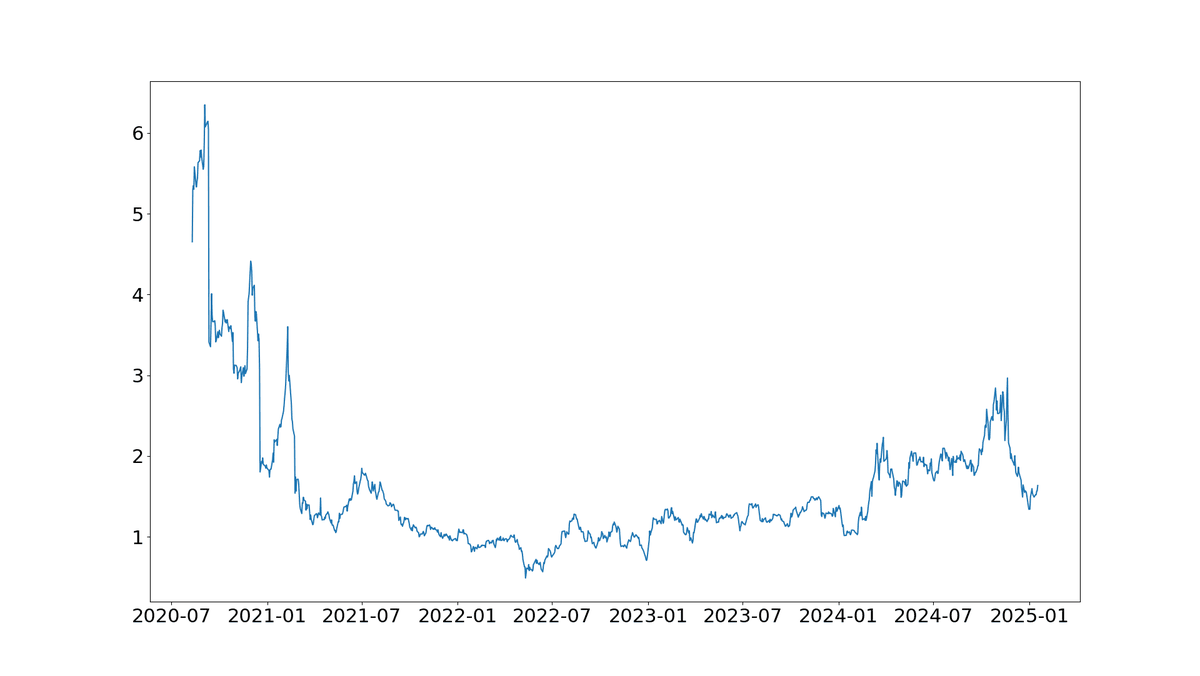
Can we do better? A common trick when operating mean reversion is to use something like a moving average to estimate “fair value” for the premium. Rather than assuming the premium will always shrink to zero (which would be a ratio of 1 in the second graph), we assume it will revert to the moving average. But moving averages always lag, so we still end up playing catch up in a strong secular trend.
The flaw with both of these ideas is that we are naively assuming that the MSTR “investors” are, like us, rational people. Clearly they are not! Let us try and model that irrationality.
04A Simple Model of MSTR Value
To model MSTR properly from an accounting perspective would be quite complicated. It has some funky convertible debt, so we’d need an option pricing model6. There are also some triggers and covenants in their debt, resulting in nonlinear sensitivity to BTC price.
But all of this is pretty second order; BTC would have to fall quite a lot before MSTR would have issues with its debt. They also have a relatively low debt servicing cost, thanks to those cheap convertibles. So the sensitivity of its “accounting value” to BTC is pretty close to 1$ = $1.
But we don’t care about any of that! We can’t trade “accounting value”, only equity value. Let’s begin from first principles:
Enterprise value = Equity market cap + Debt
= MSTR core business value + BTC value owned + vibes value
BTC value owned = BTC coins held × BTC price
… where “vibes value” is the enterprise value of MSTR which can’t be explained by its core business, or by the mark to market value of the Bitcoin it holds. It seems reasonable that this will depend on the price of Bitcoin; probably the higher BTC is, the more “vibes”. Rearranging:
Market cap = (MSTR core business value − debt) + BTC value owned + V(BTC value owned)
V is the “vibes” function; it gives us the responsiveness of the market valuation of MSTR to BTC above and beyond what the actual balance sheet value is. We allow V to be time varying. If we assume that V is a linear function7, we can write this as a function to estimate:
Market cap = α + β × BTC value owned + ε
Where:
- α, β are to be estimated; and we allow them to be time varying.
- α includes the MSTR core business, debt, and any fixed part of the “vibes” function. I currently estimate this at $2.8bn, suggesting the MSTR core business is worth negative several billion dollars.
- β incorporates the accounting value of BTC, and the linear part of the “vibes” function. My current estimate for this is 1.71; this is 71% higher than if the market value of MSTR had a 1:1 sensitivity to the mark to market account value of BTC. We have quantitative proof that “vibes” exist, and are positive!
- ε is the error term, which we assume to be mean reverting. This is what we will use to construct our positions.
05Fitting the Model
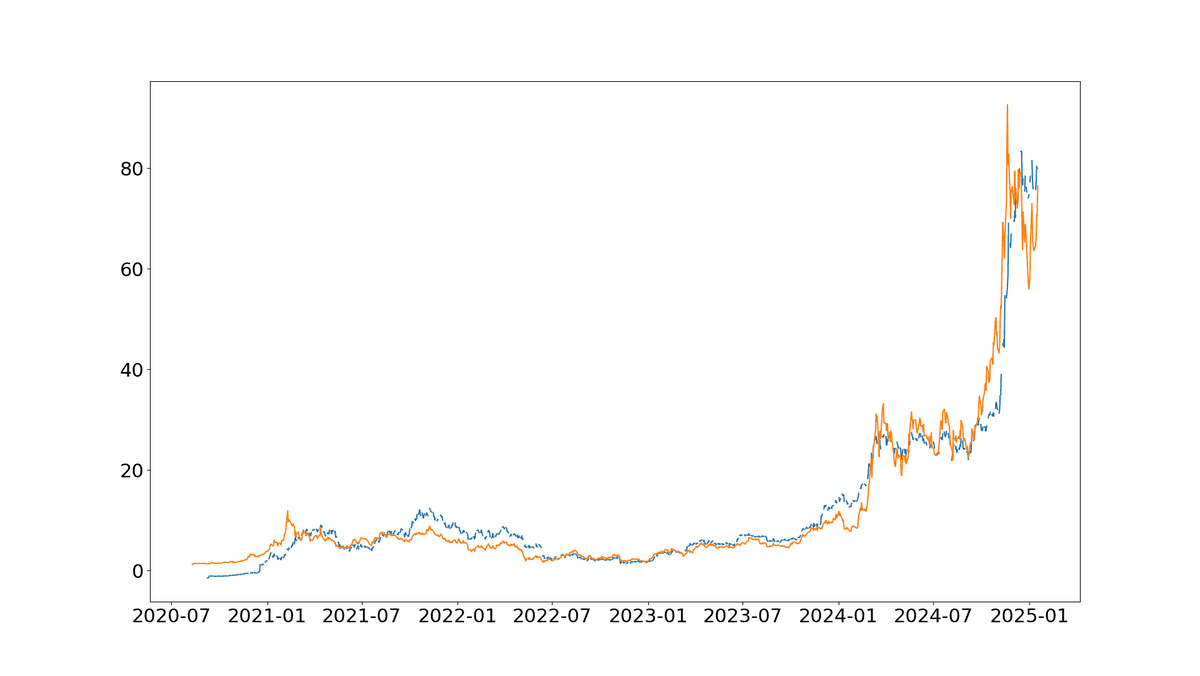
As we know vibes “shift” and we don’t want to estimate parameters in sample, let’s use a rolling 12 month window for our estimation (refitting daily). Here is the fitted (blue) and actual (orange) market cap, with the fitting done using backward looking parameter estimates:
Now for the error term (market cap – fitted market cap):
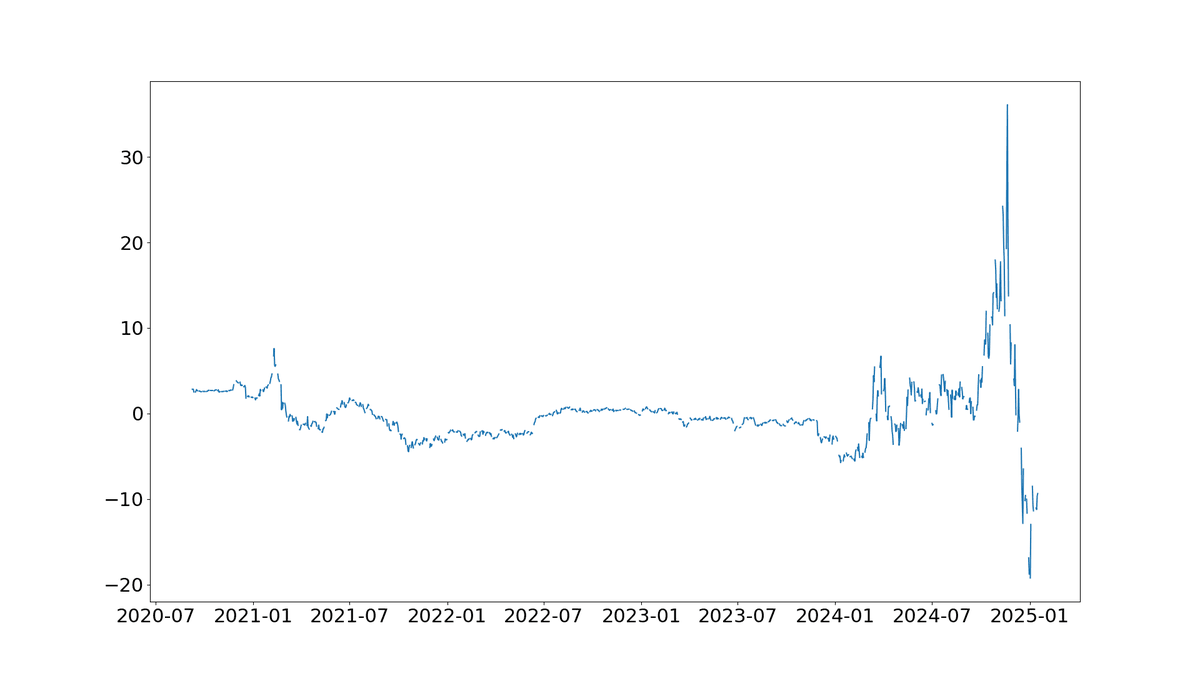
A positive error term means the market cap is too high (and we should sell MSTR / buy Bitcoin); a negative error term means it is too low (buy MSTR / sell Bitcoin). The strategy will be profitable if the error term mean reverts. It looks like this is happening.
This is easier to see if we normalise the error term, dividing by the current market cap:
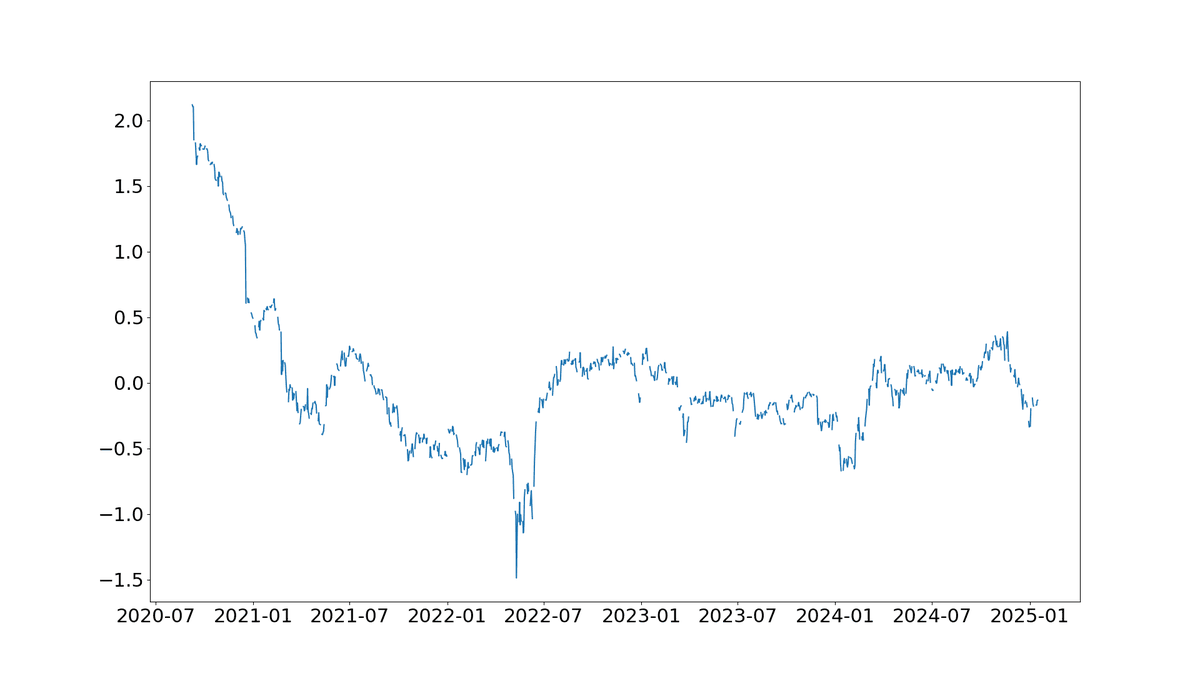
That certainly looks like a vaguely mean reverting time series. We can see that errors of up to 50% of market cap have been available at times in the last couple of years; with even larger differences prior to that.
06Trading the Model
Let’s now dive into the weeds and see how this model can be traded in practice. Recall:
Market cap = α + β × BTC value owned
If we include all the individual components:
MSTR price × MSTR shares outstanding = α + β × BTC price × BTC coins held
This gives us the following:
MSTR price = (α / MSTR shares outstanding) +
(β × BTC coins held / MSTR shares outstanding) × BTC price
Hence we have a hedge ratio of (β × BTC coins held / MSTR shares outstanding) when trading MSTR against BTC. Here is the hedge ratio over time:
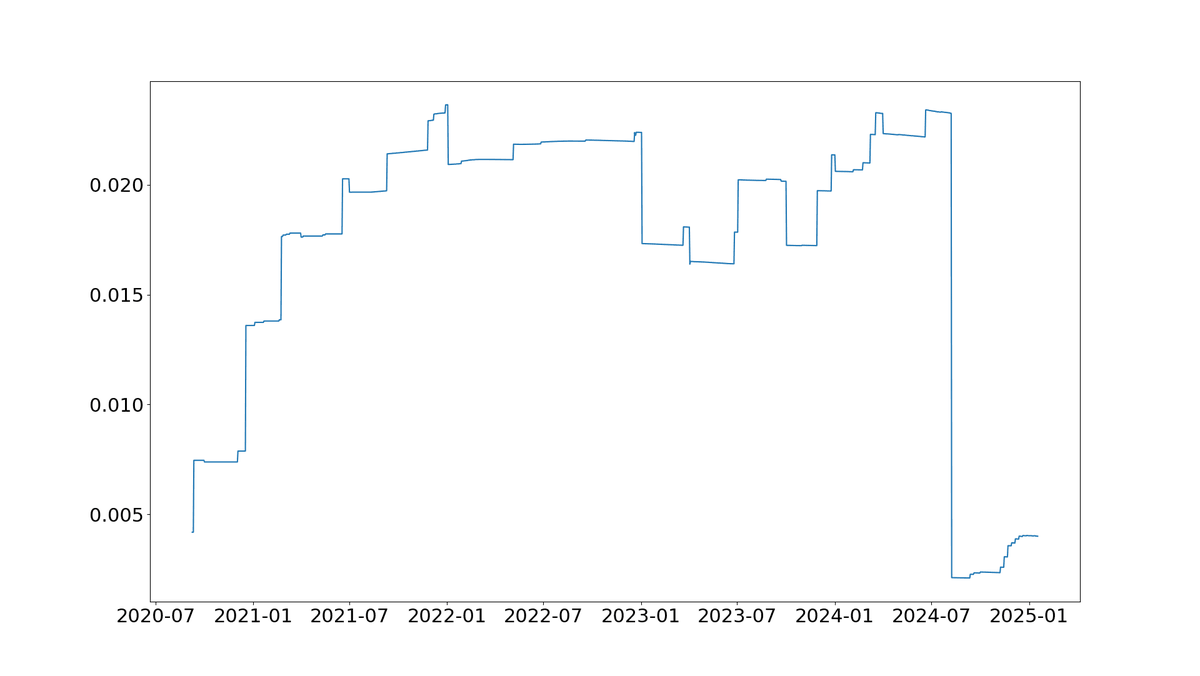
This climbs as more BTC coins are purchased, but as our estimate of β falls in recent years this causes it to flatten off. The tenfold drop in August 2024 is caused by a 10:1 share split. Here is the synthetic price of the artificial instrument we are trading: Bitcoin price × hedge ratio — MSTR price
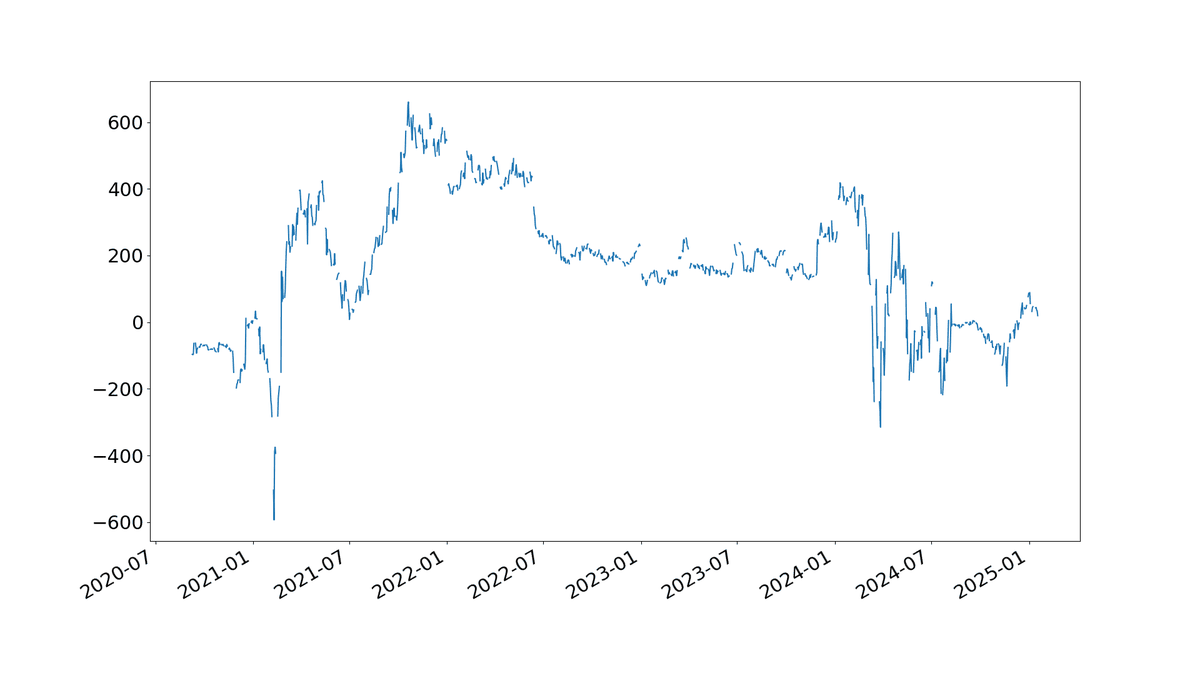
How big should our positions be? Generally it’s better to have larger positions if there is more opportunity in a trade. In this case, that would be a larger error term. To scale positions in my trading strategies, I use forecasts scaled so that 10 is an average sized position. A forecast of +10 indicates an average long position; -10 is an average short, -20 would be double the average short, +5 would be half the average long and so on.
We can construct a forecast by taking the error term from before, divided by the market cap, and then multiply by 20. Thus an error term of 50% would give us an average sized position of +10 or -10. If you think the smaller errors of recent years are more likely in future, you might want to be more aggressive.
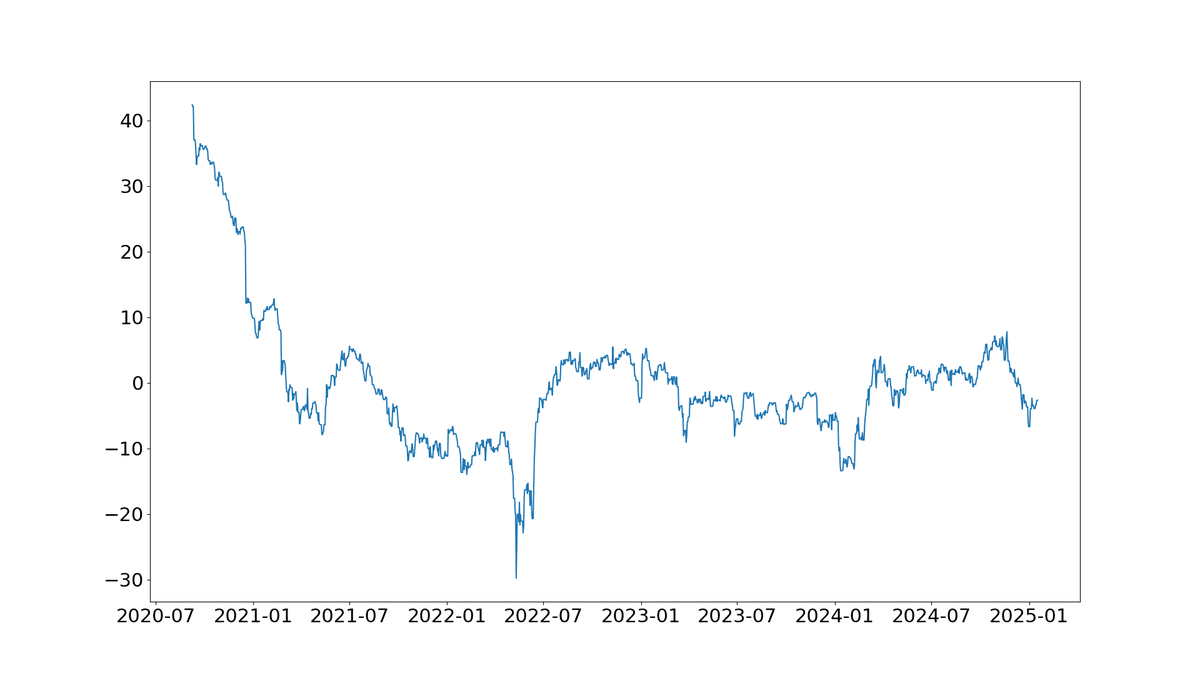
The plot above shows the forecast over time. A positive number means we would be long BTC/short MSTR; a negative number implies the reverse. Unlike a simple “premium reverts to zero” model, we have a more balanced series of longs and shorts.
07A Trade Example
Let’s look at how we would construct this trade today (7th April 2025). Note that most of these figures are handily available from the (Micro)Strategy website, apart from the α and β.
Current estimates — 7 April 2025
- β
- 1.71
- α
- 2.82
- MSTR price
- $268.44
- Market cap
- $71.453 billion
- Shares outstanding
- 266 million
- Bitcoin price
- $78,565
- Bitcoin held
- 528,155
- Value of bitcoin held
- $41.5 billion
Hedge Ratio Calculation
We define the hedge ratio as:
Hedge ratio = (β × BTC coins held) / MSTR shares outstanding
= (1.71 × 528,155) / 266,000,000
≈ 0.003392
Thus, to hedge 1 BTC, we should hold:
1 / 0.003392 ≈ 294.72 MSTR shares
At a price of $268.44 per share, this equates to:
294.72 × $268.44 ≈ $79,117
This is slightly more than 1 BTC ($78,565), so this is close to being an equal notional hedge.
Error Calculation
Error = actual market cap − (α + β × BTC value held)
= 71.453 − (2.82 + 1.71 × 41.5)
= 71.453 − 73.785
= −2.332 billion
Normalising the error by dividing by market cap = -2.332 / 71.453 = -0.033
The market cap is lower than the fitted value, so we should buy MSTR and short BTC. In this case the error is quite small at just 3.3% of market cap.
Multiply by approximate forecast scalar of 20 = -0.033 × 20 = 0.66
Currently then the forecast is pretty weak and we’d have a position of less than one-tenth of the average. Concretely, assuming we had $10m of capital with an annualised standard deviation target of 20%, which comes out to $2m a year, here is how we would calculate our average position:
Daily standard deviation of synthetic price (Bitcoin price × hedge ratio – MSTR price) = $20
Annual standard deviation = 20 × 16 = $320
Ignoring the forecast for the moment, we want to hold $2m / $320 = 6250 units of the spread, which is long 6250 MSTR shares versus short 0.003393 × 6250 = 21.2 Bitcoin. Note that both legs have a notional value of around $1.7m, and the total position size is about $3.4m. However, because the forecast is only 0.66 in practice we multiply all these numbers by (0.66 / 10): giving us short 1.4 bitcoin vs long 412 MSTR.
08Accounting Example
I probably wouldn’t bother putting on such a small position, on a weak forecast which is unlikely to overcome costs, but what kind of profit could we hope for if we had a larger error, of say -50%? In that case we’d have the full sized position of short 21.2 BTC and long 6,250 shares of MSTR.
Let’s assume the error goes to zero, and for simplicity does it entirely on the MSTR price. If the error was 50%, this implies that the MSTR market cap – and price – would have doubled. That gives us a gross profit of $1.68mn, or 16.8% of our notional capital. Even if that reversion took a year, which is slow by historical standards, that isn’t a bad return. In Sharpe Ratio terms, the profit comes out to 0.84.
Rolldown losses on the short futures position would be roughly equal to the risk free rate, but we’d have to pay a spread above risk free on borrowing to buy the MSTR shares. Even if we had to pay base + 1% in margin, we’d still be ahead here.
09Simulated Returns
Let’s find out how this strategy performs, with all the usual caveats about a back-tested simulation definitely not representing what might happen in the future. Here is a simple account curve, with no costs or borrowing costs:
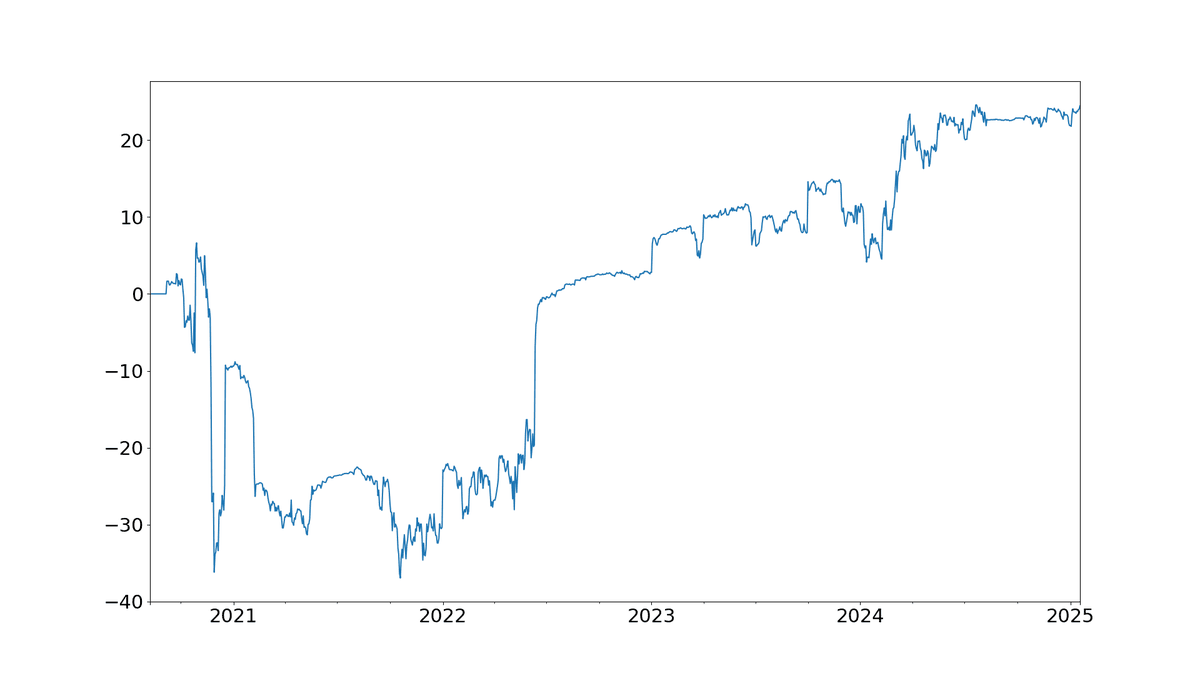
It’s a pretty wild ride in the early years; but in the last couple of years we see quite a nice standard mean reversion profitability (periods of steady returns, followed by sharp drawdowns which are quickly reversed). More recent forecasts are quite small, so there is less risk.
What doesn’t this include:
- stock borrowing costs for MSTR (currently quite low at around 0.5% annualised)
- futures rolldown on Bitcoin (pretty close to risk free, about 6% a year),
- net interest/funding costs
10Conclusion
Vibes exist, and we have managed to quantify them. The maths in this model makes it superficially safer than a simple “let us assume that the NAV premium closes to zero” strategy. But all the caveats mentioned earlier apply. History may repeat itself, and the ghost of Freeserve may come to haunt us. And mean reversion trades tend to suffer in periods of high uncertainty...
Footnotes
- It isn’t that easy, which is why a lot of people just buy trusts with big discounts to NAV and hope. People like Saba Capital. And people like me, whose ISA consists mostly of investment trusts currently showing a mark to market loss of about 30%.
- Note for Millennials and Gen-Z; an ISP was an ‘internet service provider’ whose services were required to get dial-up access to the internet.
- As an impoverished student I bought into that Freeserve IPO (due to massive oversubscription each investor was allocated about £80 of shares), and I later did an analysis of this trade as a case study which I used in my interview with the Barclays Capital equity research team. I didn’t get that job, but I did get hired by the trading desk. Please draw your own conclusions from this anecdote.
- This would have ended up being a very profitable trade; Freeserve fell 85% in the dot com crash of 2000, whilst Dixons merely halved.
- I note in passing that these guys are not great traders. They started buying when BTC was $10k, and yet they’ve only made a 35% MTM profit.
- As far as I know, MSTR is the only publicly listed firm that is proud of, and advertises, its realised and implied volatility. Because, naturally, that is what makes its convertible debt so cheap.
- Initially I allowed V to be quadratic but the squared terms were not significant, so I dropped them.
Important Disclosures
This material has been prepared by Stylus Capital Partners, LLC (“Stylus”) and is provided for informational and educational purposes only. It is not intended to provide investment advice, nor does it take into account the specific investment objectives, financial situation, or needs of any particular investor. Before making any investment decision, recipients are urged to consult with their own financial, legal, tax, and other professional advisors.
This material does not constitute an offer to sell, or a solicitation of an offer to buy, any securities or financial instruments. Any such offering will be made only pursuant to a confidential offering memorandum and subject to the terms and conditions set forth therein. No investment decision should be made based solely on this material, which is illustrative in nature and may include assumptions that are subject to change without notice.
Stylus’s actual investment strategies and positions may differ materially from any views or models presented herein, and are subject to change based on client mandates, risk considerations, transaction costs, market conditions, and other factors. Nothing in this document should be construed as a recommendation to buy or sell any particular security or investment. The securities or companies mentioned herein are for illustrative purposes only and do not represent actual portfolio holdings or future intent.
All investments involve risk, including the risk of a complete loss of capital. The value of investments and the income derived from them can go down as well as up, and there is no assurance that any investment strategy will achieve its objectives. Investments involving leverage, derivatives, short selling, or other complex instruments may carry higher degrees of risk and may not be suitable for all investors. Past performance is not indicative of future results, and forward-looking statements should not be relied upon as guarantees of future outcomes.
This material may reference data and analysis derived from both internal and external sources, including public and subscription-based databases. While we believe such information to be reliable, Stylus does not guarantee its accuracy, completeness, or timeliness, and disclaims any liability for reliance on it. The views and opinions expressed are those of Stylus as of the date indicated and are subject to change without notice.
This material is not directed at or intended for distribution to any person in any jurisdiction where such distribution would be unlawful or where Stylus would be subject to additional regulatory requirements.